2020 Market Outlook
Elbrus Partners, LLC
Last Update: March 12, 2020
CURRENT MARKET RISK FACTORS
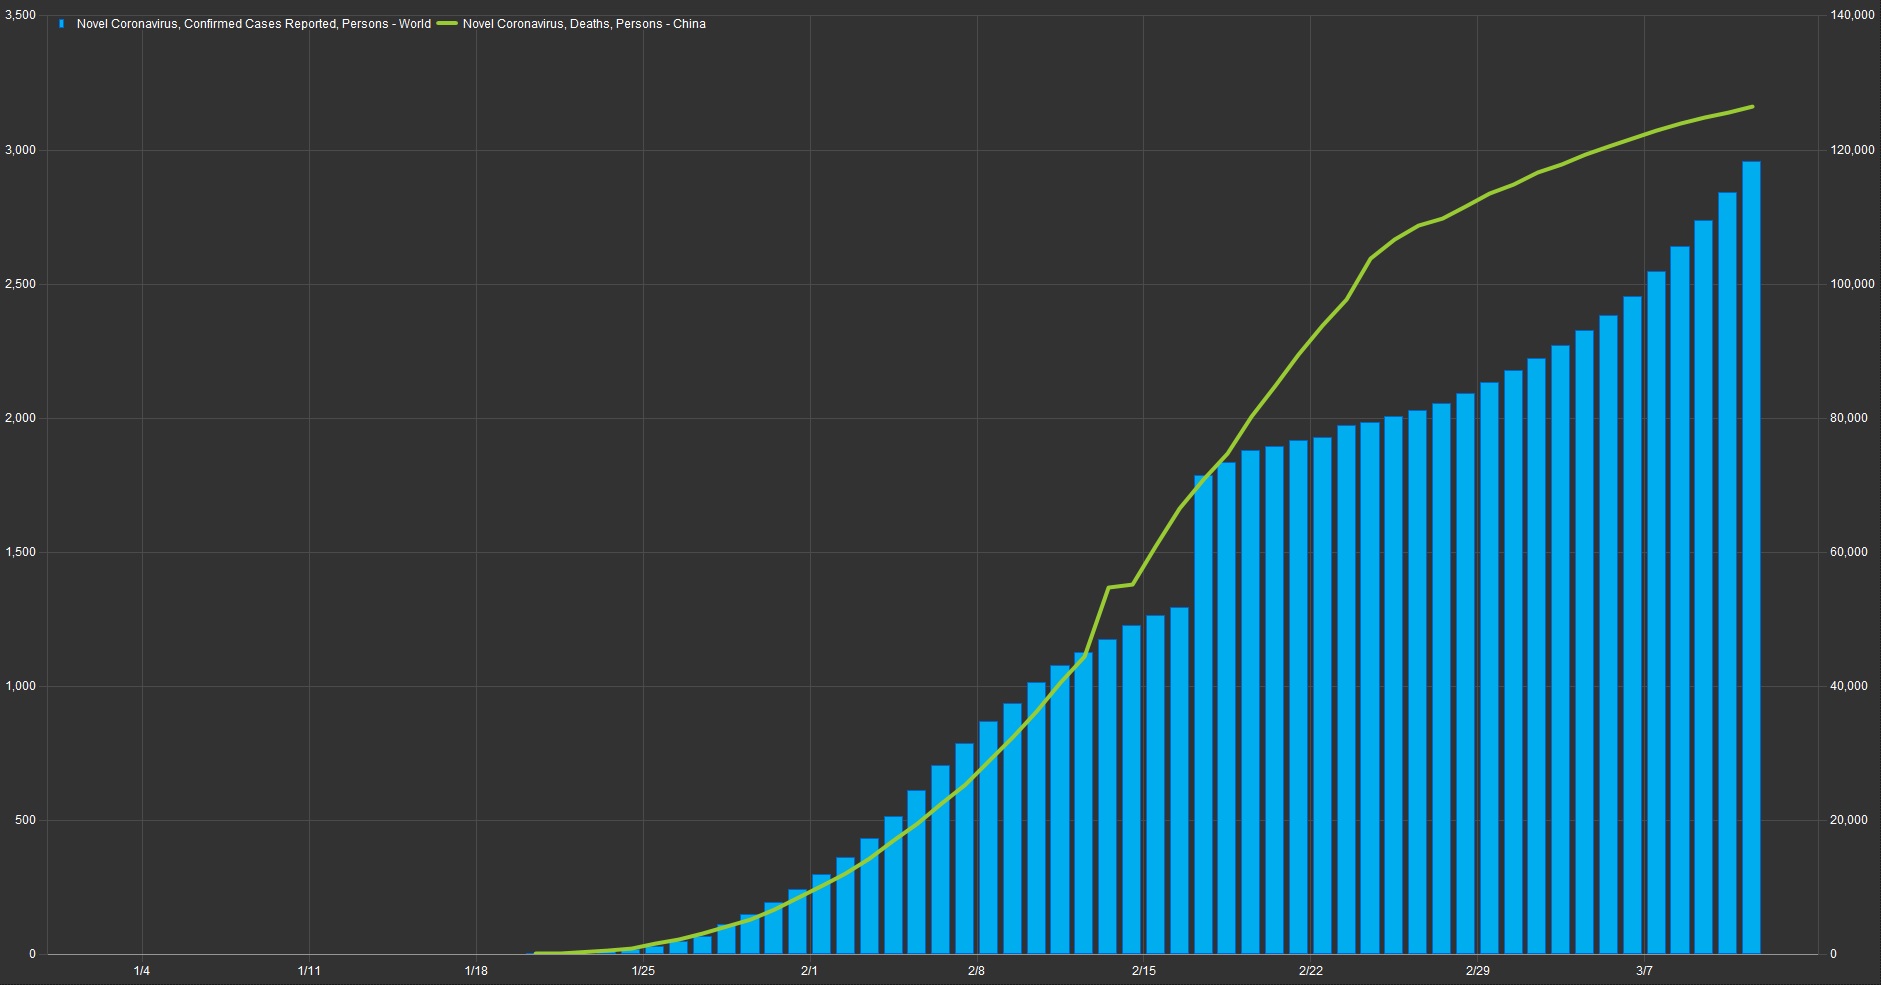
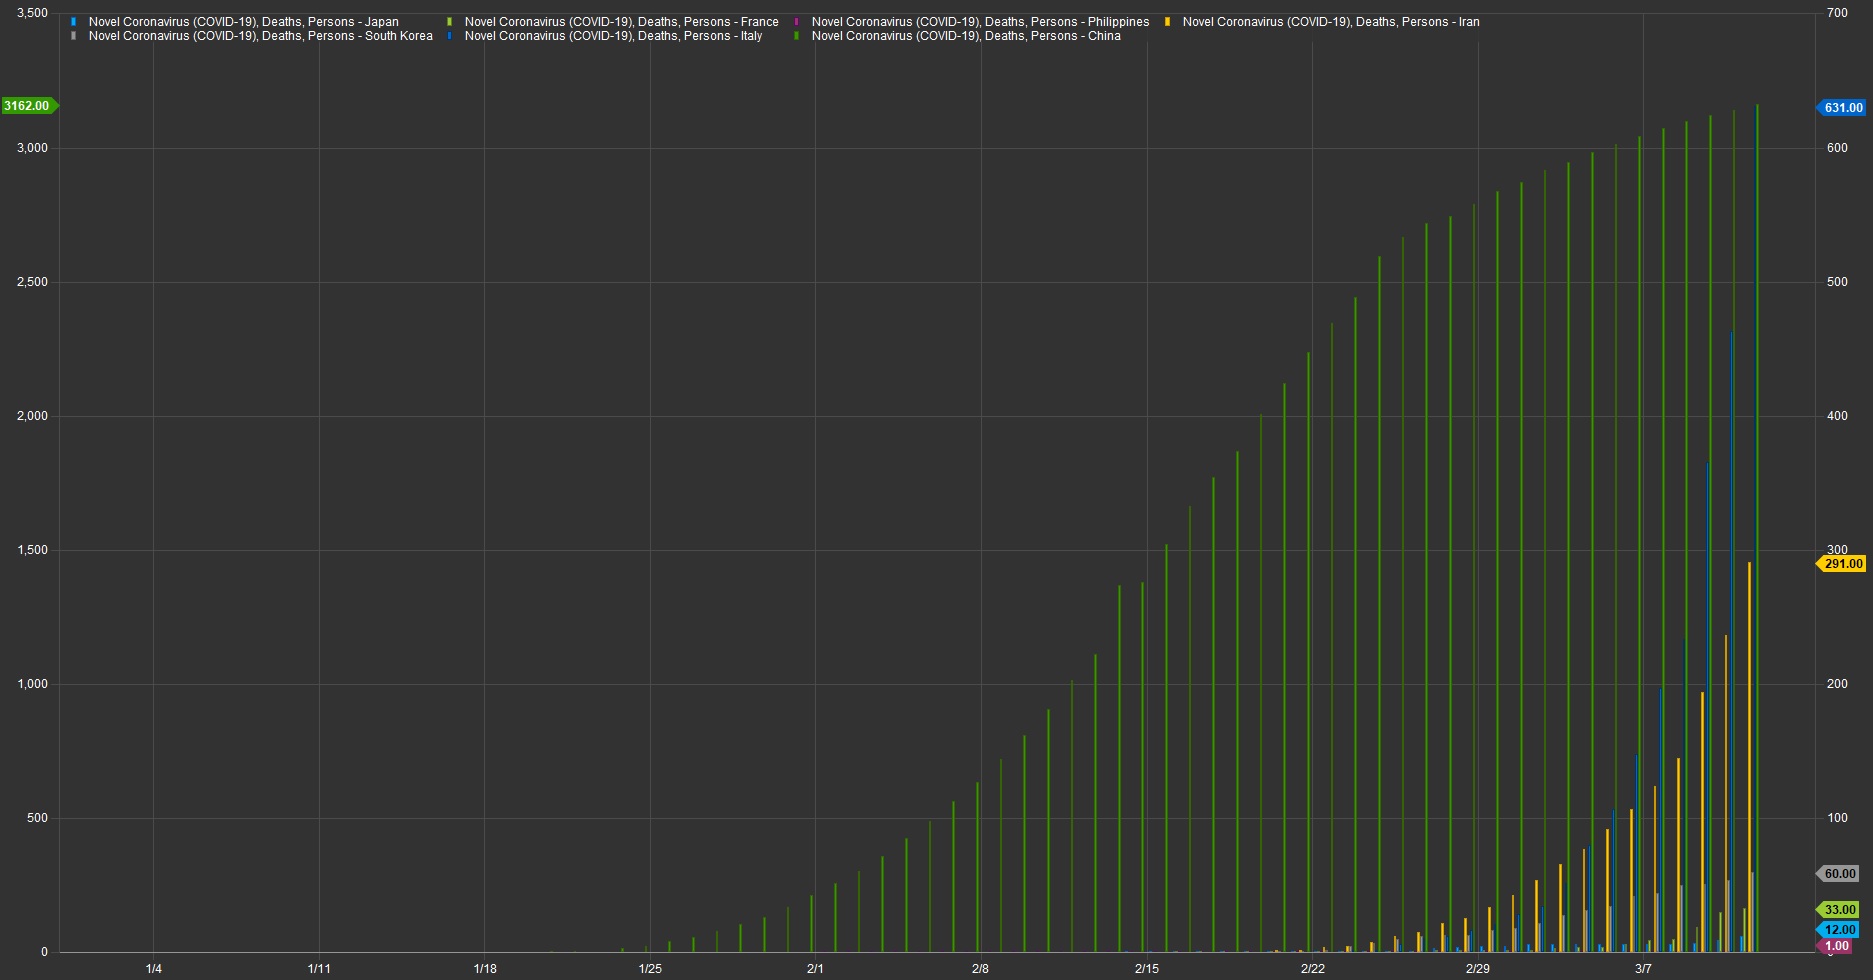
Novel Coronavirus
(COVID-19)
On January 9, 2020, the Chinese health authorities and the World Health Organization (WHO) announced the discovery of a novel coronavirus, known as 2019-nCoV, which was confirmed as the agent responsible for the pneumonia cases.
The first confirmed case of 2019-nCoV infection in the United States was reported on January 20, 2020.
Over the weekend of January 11-12, the Chinese authorities shared the full sequence of the coronavirus genome, as detected in samples taken from the first patients.
Advances in genome sequencing, show progress relative to the SARS outbreak in 2003, the full sequence of the genome was not published until months after the first initial cases were reported. This process was done in a matter of days with human clinical trials currently in progress. Effectiveness and regulatory approval will become clearer over the coming months; until then we must focus our efforts on reducing the spread of infection.
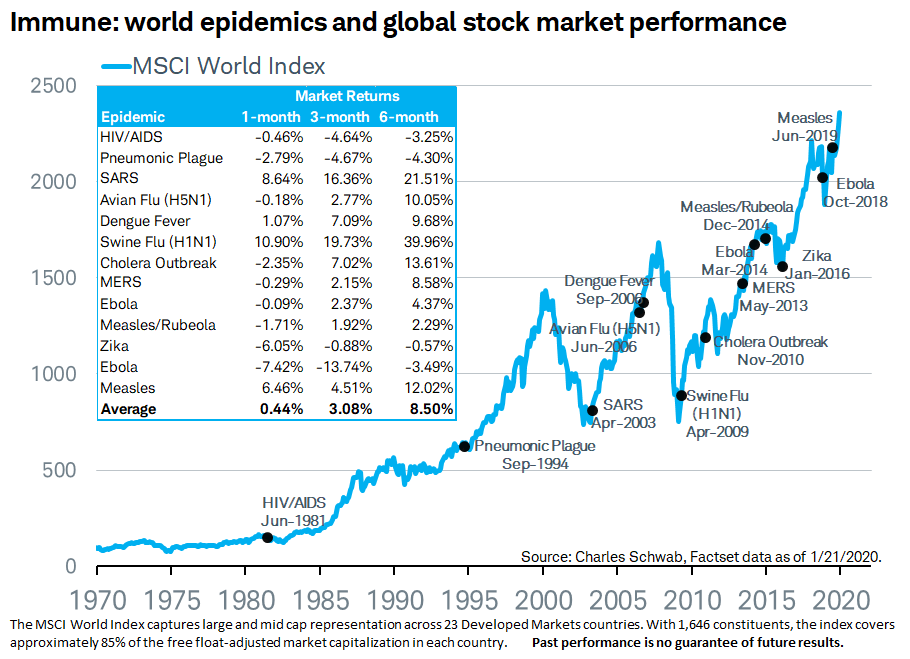
Markets have historically managed well through several prior viral outbreaks. While Cornovirus will undoubtedly have deeper external shocks and economic implications; historical market performance tends to improve in the ensuing 3-12 month period.
Coronavirus Related Links:
Flattening the Coronavirus Curve - NYT
First Case of 2019 Novel Coronavirus in the United States - The New England Journal of Medicine
A pneumonia outbreak associated with a new coronavirus of probable bat origin - Nature Research
Coronavirus Declared Pandemic by World Health Organization - WSJ
Oil Price War
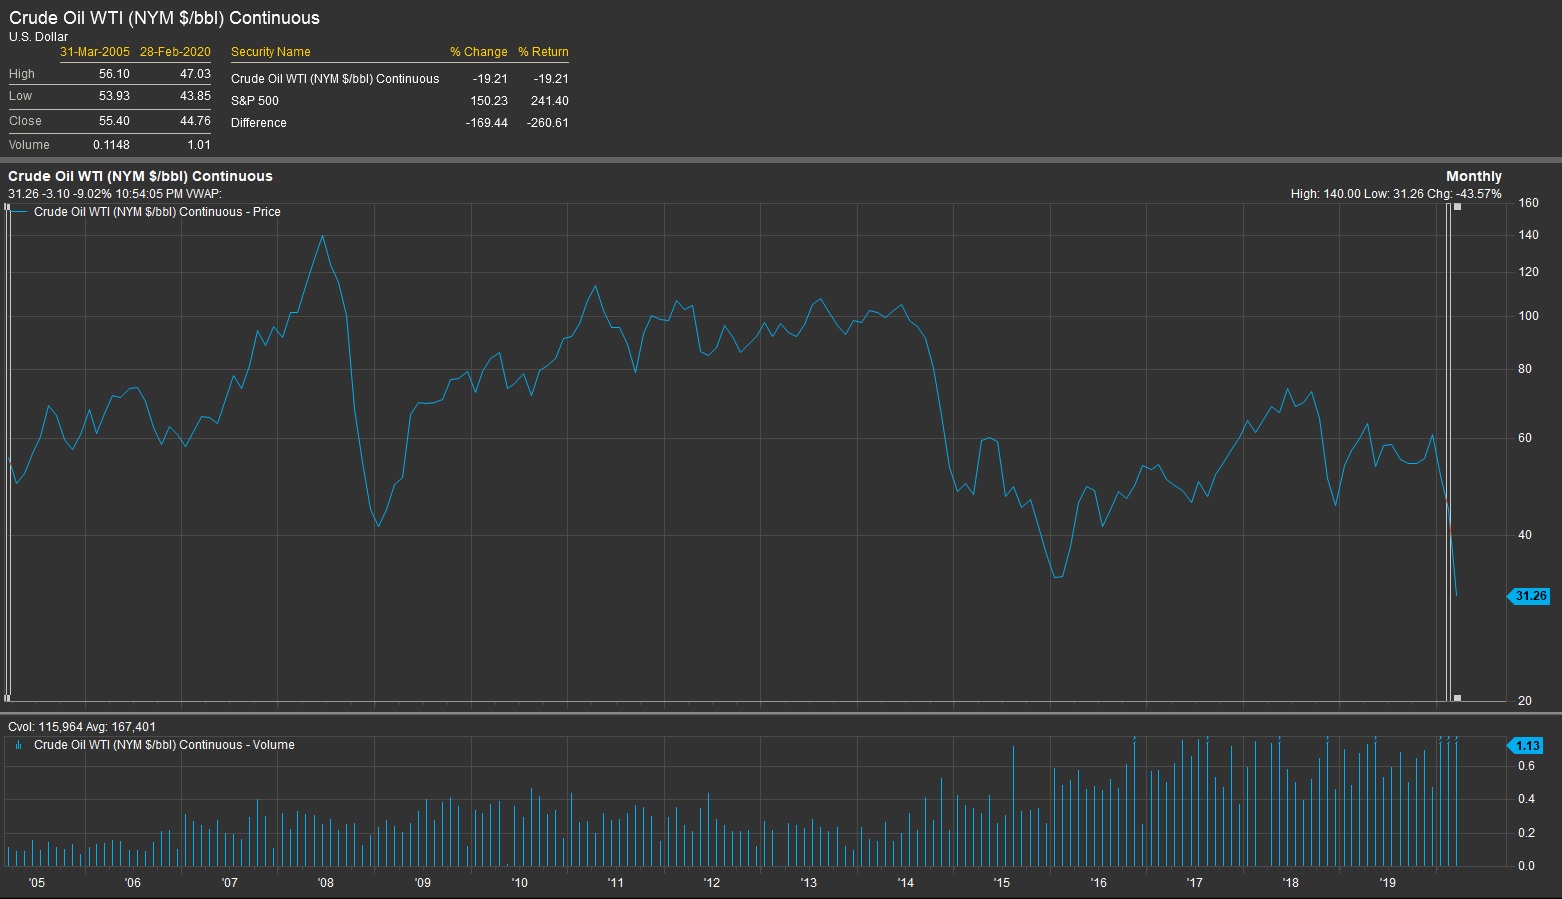
On March 6, 2020, the OPEC+ deal failed, ending the three-year pact between OPEC and Russia. Oil prices crashed 30% at the opening Sunday evening; unleashing a price war between Russia and Saudi Arabia.
The S&P 500 Energy Sector now has a negative return going back until 2005.
The US economy has overall remained resilient with oil price shocks in recent history, for example, WTI-Crude Oil per barrel crashed over 60% from 2014-2016 while the S&P 500 index appreciated over the time horizon. Both drops in oil prices spurred by countries seeking to increase their market share of global oil consumption at the expense of reduced margins. In 2016, new independent estimates revealed the United States has more recoverable oil reserves than both Saudi Arabia and Russia combined. The new supply created both national security and competition for OPEC, but our cost of extraction is higher using horizontal drilling and fracking. Another downward factor has been the shift towards alternative energy and climate change initiatives.
Impact on the sector is ongoing, as many energy companies are highly leveraged with debt. The decline in oil prices could put stress on company margins/earnings, and extend to credit markets with related exposure.
Markets in Turmoil
As market volatility, measured by the VIX Volatility Index, reaches the highest levels since the 2008 financial crisis, additional monetary and fiscal stimulus is forthcoming.
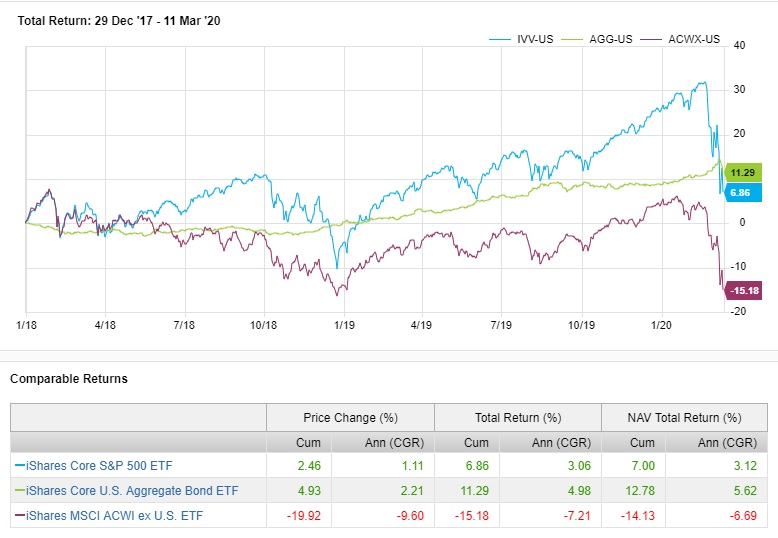
Jan 2019 - Jan 2020 - To better understand the velocity of this market sell-off it is helpful to review recent market performance.
Following the correction in late 2018, markets began to surge. During the Q4 2018 decline, markets perceived possible fed policy error with monetary tightening in an attempt to normalize interest rates while global economic recession risk increased aided by the trade-war and geopolitical tensions.
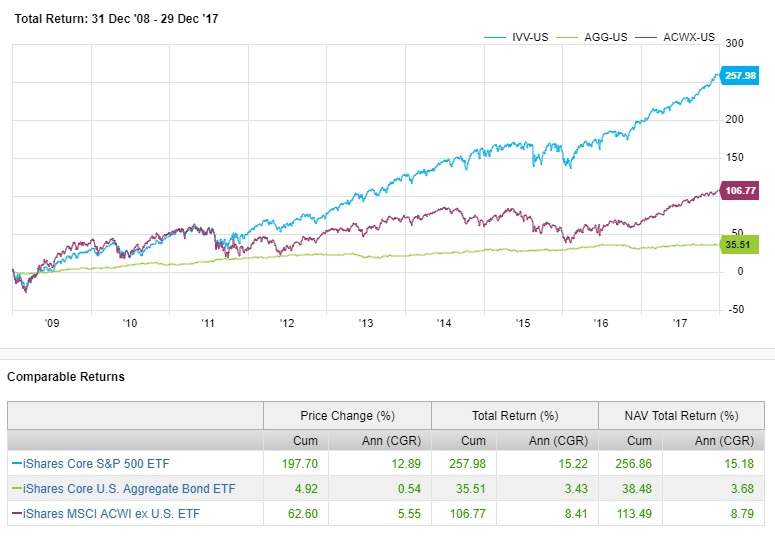
Even with the run-up in asset prices; major indices are now negative since the beginning of 2018. The All-Country World Index ex-US is declined over 20% since January 1, 2018. In contrast, long-term investors have been well-rewarded post-financial crises in the bull market run from 2009-2017.
Fiscal Policy - On March 5, 2020, the Senate approved an $8.3 billion emergency coronavirus package. On March 12, 2020, the house will vote on a coronavirus economic stimulus bill. The stimulus strategy is currently undecided with several proposals ranging from free coronavirus testing, expanded unemployment insurance, and cutting payroll taxes.
House to vote Thursday on coronavirus economic stimulus - The Hill - March 11, 2020
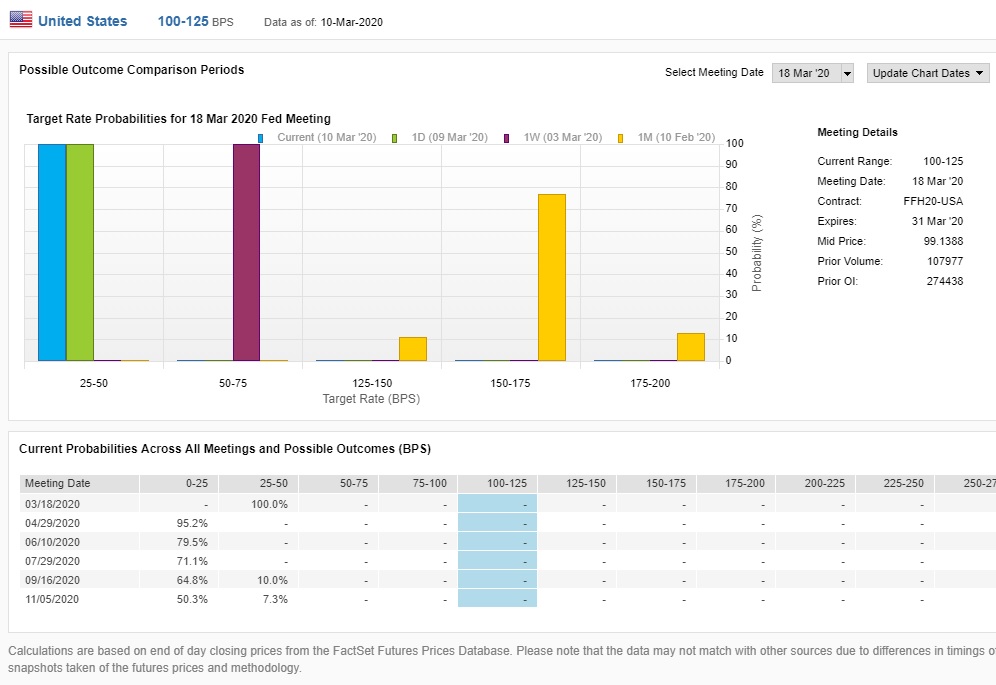
Monetary Policy - On March 3, 2020, the Fed in a surprise move cut its benchmark interest rate by 50 basis points. Current probabilities for an additional cut by the March 18, 2020 meeting is at 100%. In addition, the chart below shows a high probability of continued rate cuts throughout the year.
Fed cuts rates by half a percentage point to combat coronavirus slowdown - CNBC - March 3, 2020
Global Recession Risk - Market shocks resulting from the oil price war and Coronavirus has lead to many companies removing FY20 guidance, implementing firm policies to safeguard employees/ customers, and canceling upcoming conferences/events. In addition, governments around the world have enacted travel and gather restrictions.
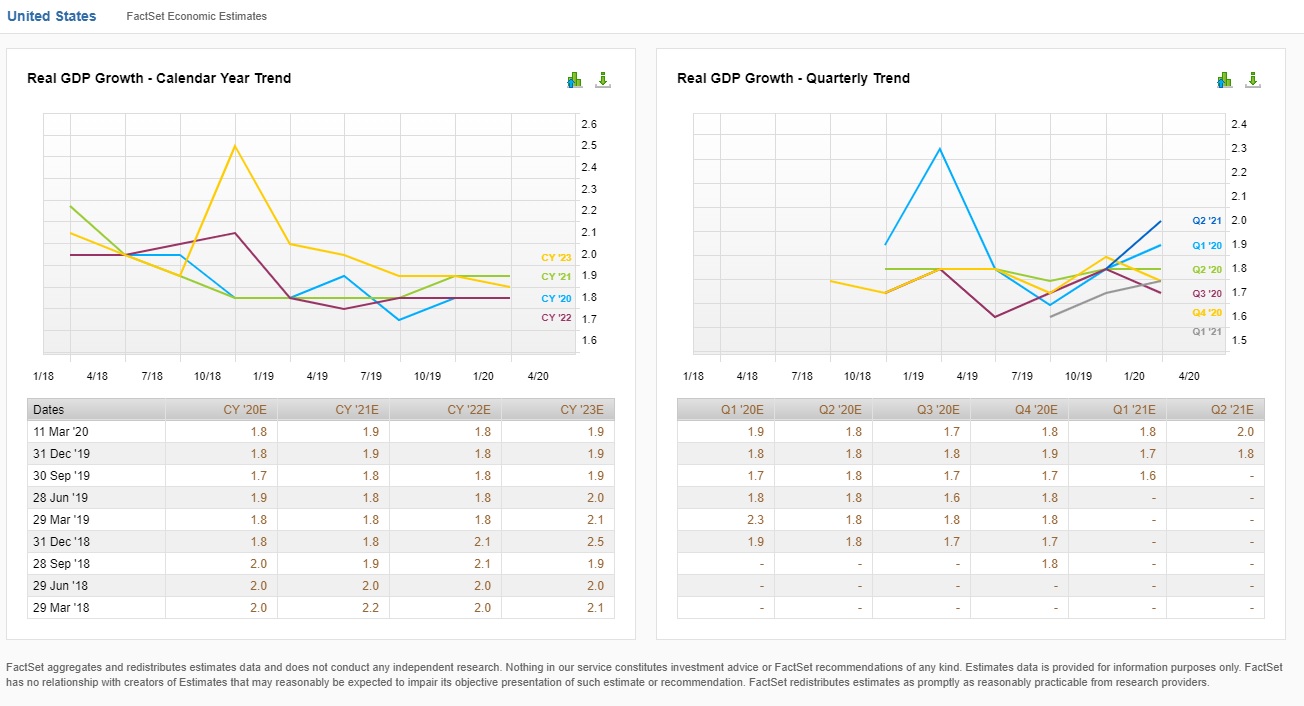
The most impacted sectors have been travel, hotels, restaurants, and energy. This leads to an increased risk of strong consumer continuing to be the primary economic growth driver. Contagion risk also increased as stress trickles through associated industries and credit markets. Real GDP Growth estimates have trended downward over the past year.
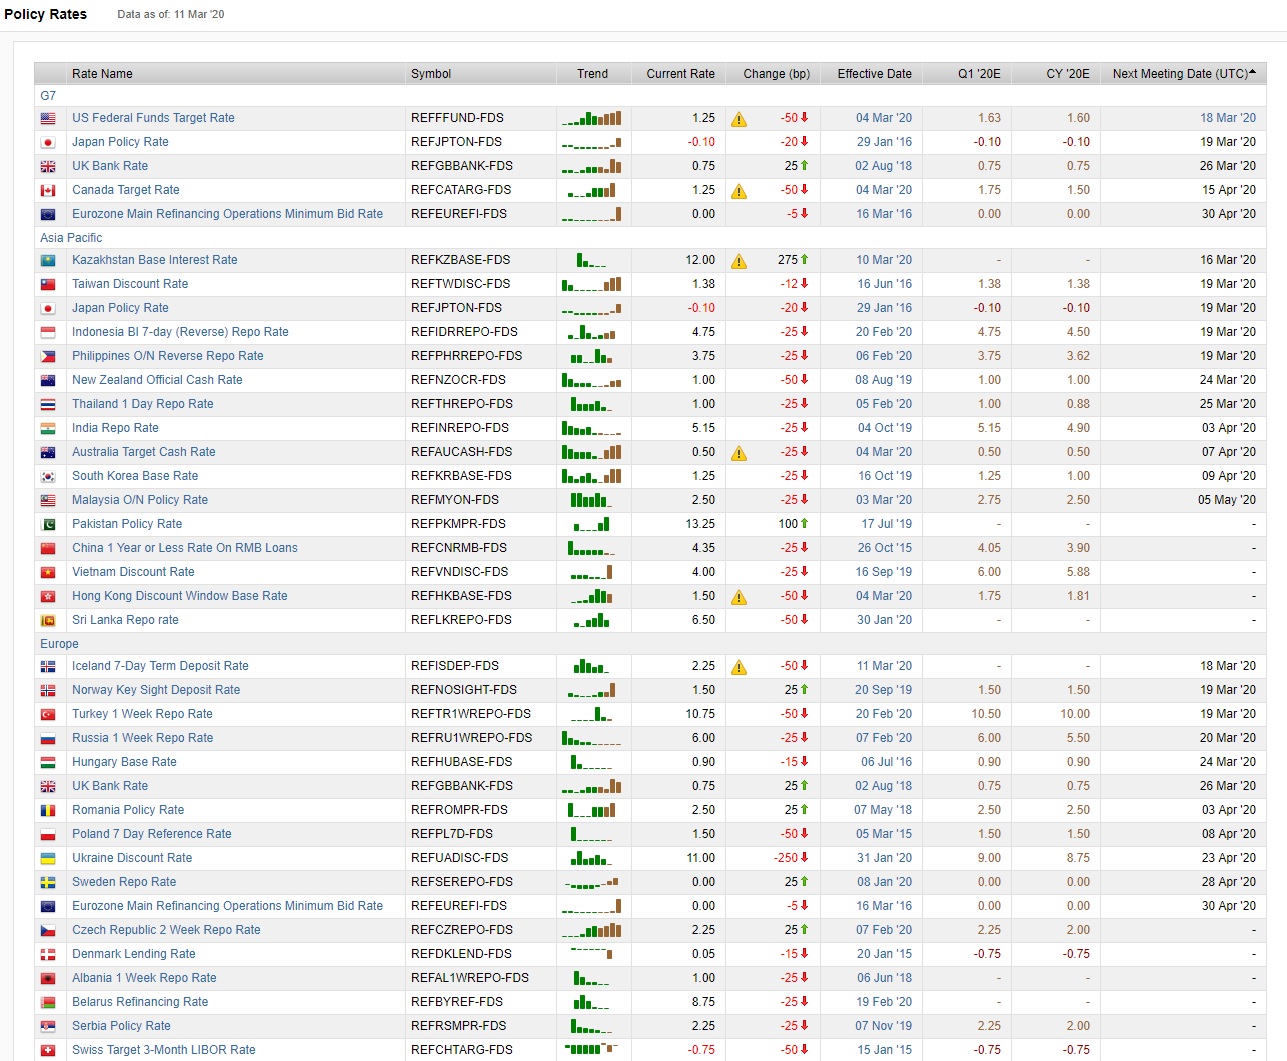
The efficiency and long-term implications of easing monetary/fiscal policies are debatable; however, the policy shift could provide some reprieve for financial markets. Central bank policy rates below depict a coordinated global effort.
Portfolio Strategies for 2020
Bear-Market Territory - Major indices down over 20% from all-time highs creating potential opportunities to take advantage of short-term market disequilibrium.
While we remain constructive on specific sub-asset classes, a cautious approach may be advised as the market bottom is uncertain.
Harness the volatility - In our view, we have reduced the likelihood of V-shared recovery, in favor of a 6-12 month U-shared recovery coupled with heightening volatility. New information and policy change can result in rapid asset repricing as investors reassess a securities intrinsic value.
Tactical adjustments within the investor's risk/return parameters may be appropriate and help maintain asset allocation goals while exploiting shifts in the business cycle.
Rebalance Strategy - Time and threshold rebalancing across diversifying asset classes can potentially take advantage of short-term mispricing and volatility.
Strategic Asset Allocation / Investment Policy Statement - The guidelines and parameters created by the Investment Policy Statement and Strategic Asset Allocation may help you stay invested during volatile markets.
Global Market Portfolio - Financial theory and academia suggest a global portfolio weighted by market capitalization of the assets should be used as a baseline asset allocation.
The breadth of our managed asset program along with using Interactive Brokers as our custodian may provide investors with increased global market access across a range of asset classes and securities that could be currently underutilized.
Elbrus Partners Managed Asset Program (EP-MAP)
The Elbrus Partners Managed Asset Program (EP-MAP), bundles ongoing investment advice with portfolio management and financial planning services into a unified platform.
We build diversified global asset allocation portfolios using custom-tailored and model-based strategies. Portfolios typically contain US Equity, Foreign Equity, Fixed Income, and Alternative asset classes.
As an RIA firm, we have a fiduciary duty to all clients and must always act in the client's best interest. EP-MAP has one transparent fee based upon assets under management. This structure may have fewer conflicts of interest and provide more comprehensive advice than other financial advisers that are not fiduciaries and/or charge commissions from selling products. With EP-MAP there are no surrender charges or lock-up periods.
Please review all important disclosures and additional information on our Privacy & Legal page.
LEARN MORE ABOUT EP-MAP
Disclosure:
Elbrus Partners, LLC is a registered investment adviser. Information presented is for educational purposes only and does not intend to make an offer or solicitation for the sale or purchase of any specific securities, investments, or investment strategies. Investments involve risk and, unless otherwise stated, are not guaranteed. Be sure to first consult with a qualified financial adviser and/or tax professional before implementing any strategy discussed herein. Past performance is not indicative of future performance. Our market update provides general market and investing knowledge, however, related links may mention securities held by the firm or clients.


